29 Jul 2018
Which Expert Network is the best?

Inex One helps professional investors use multiple expert networks – efficiently, cost-effective, and compliantly. Which is the best expert network for you?
We recently surveyed more than 120 professionals in management consulting and investment management on this question. We phrased it slightly differently: “How would you rate the service and quality of experts from the Expert Networks you’ve used? (leave blank for those that you have not used)”, and rating was made on a scale from “0 (very poor)” to “5 (very good)”.
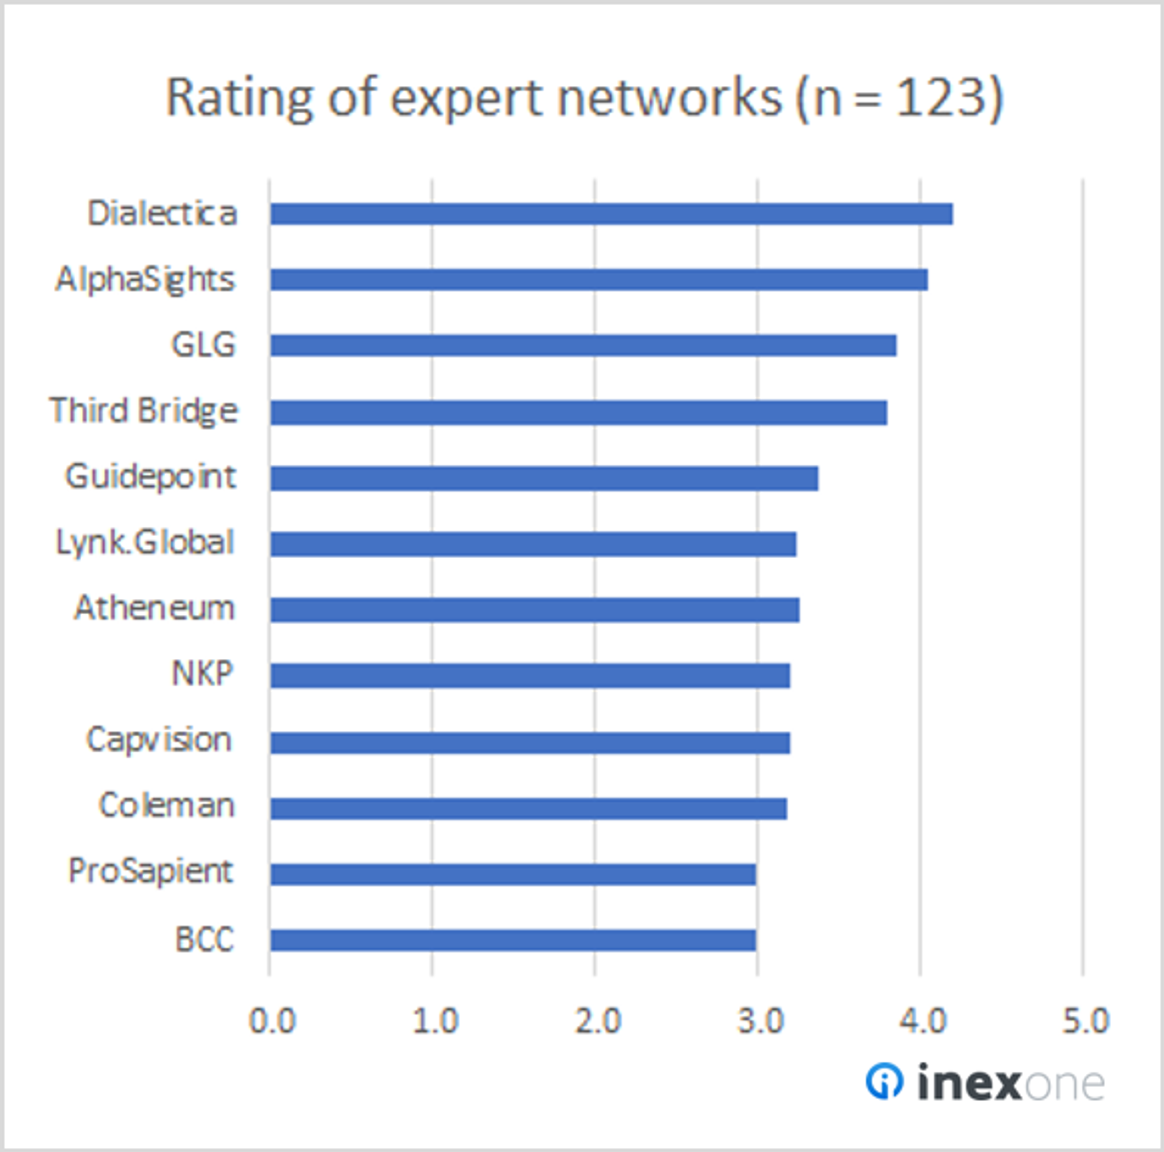
The average scores are shown below for expert networks (ENs) that received more than 5 votes:

We asked 123 professionals worldwide: “How would you rate the service and quality of experts from the Expert Networks you’ve used? (leave blank for those that you have not used)” , and rating was made on a scale from “0 (very poor)” to “5 (very good)”.
Looks like Dialectica is the best expert network, according to our sample of users. They capture the top rank ahead of more than 100 expert networks.
But is that the correct answer? What do we actually mean by “the best”? Clearly, a more scientific and data-driven approach would be to measure the actual performance. One approach could be to measure how many experts the EN supplies on similar requests (1). It should probably also include some quality metric as well, such as how many experts are selected for an interview among those supplied (2), and the ratio between the two (3). To top it off, we could also ask the customer to rate the experts’ relevance after conducting an expert call (4).
The Inex One EMS (Expert Management System) does all of this, automatically, for entire customer organizations. High-performing ENs will be identified and rewarded, whereas complacent ENs will need to step up their game or be challenged by competitors. We will revisit this post in a year or two, to announce the Best Expert Network – based on actual performance metrics.
Contact us to learn more about accessing the best expert network in one dashboard.
* Note: Not all respondents scored any EN and among those who did, many scored multiple ENs. November 2018 edit: The survey is intended as an indication of quality, not a statistically significant representation. The number of individuals’ responses, per company in the chart in descending order, is 8, 91, 105, 42, 48, 5, 15, 5, 5, 33, 7, and 5.