23 Oct 2024
B2B and Healthcare surveys - how we connect top-down with bottom-up sizings

This is part 3 of our series on the B2B and Healthcare survey sample industry. This piece explains our methodology for estimating industry turnover to $1.1 billion in 2023.
Every year, ESOMAR publishes a detailed research report on the global insights industry. We encourage you to read it! The report combines multiple detailed data sets, to generate the most comprehensive view of the industry. Sources include:
ESOMAR’s Annual Global Market Research Survey, which they send to insights associations and companies, collecting financial data, growth rates, and employment statistics.
National market research associations contribute insights and local data on their respective markets.
Individual contributions from large research organizations (e.g. Kantar, Nielsen, and Ipsos) and various other experts and participants in the ecosystem.
In the 2024 report, ESOMAR said the global insights industry was $142 Bn, and introduced the research triangle below:
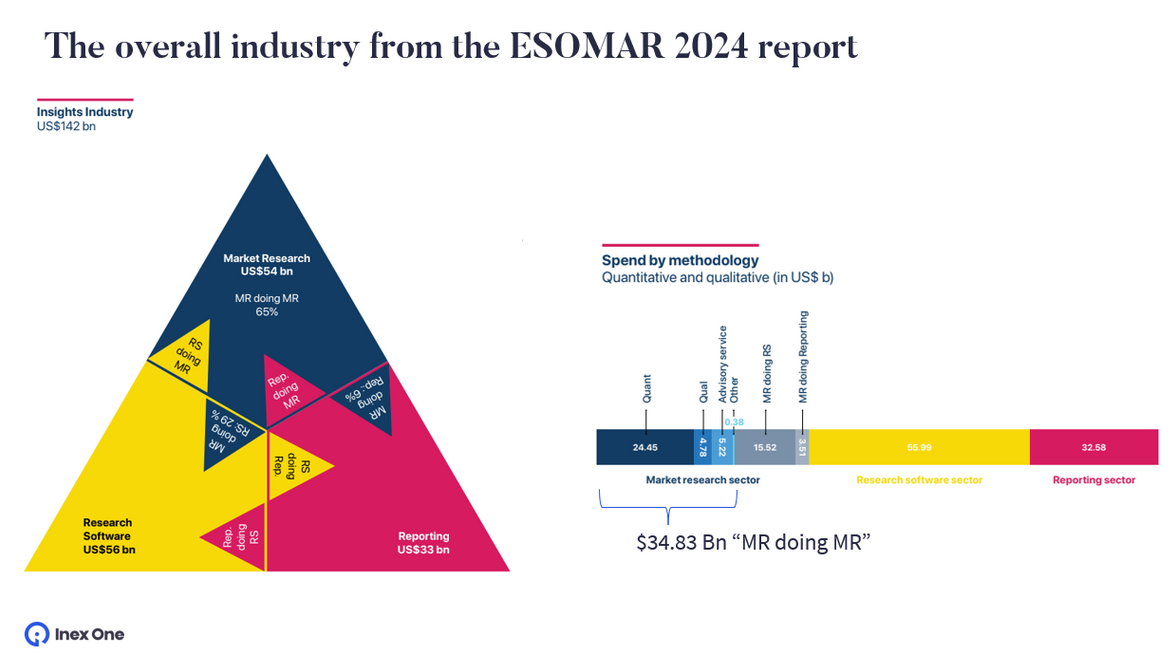
ESOMAR says that from the $142 Bn, market research is $54 Bn, out of which 65% or $34.83 Bn is “MR doing MR” (as opposed to other things like reporting or research software).
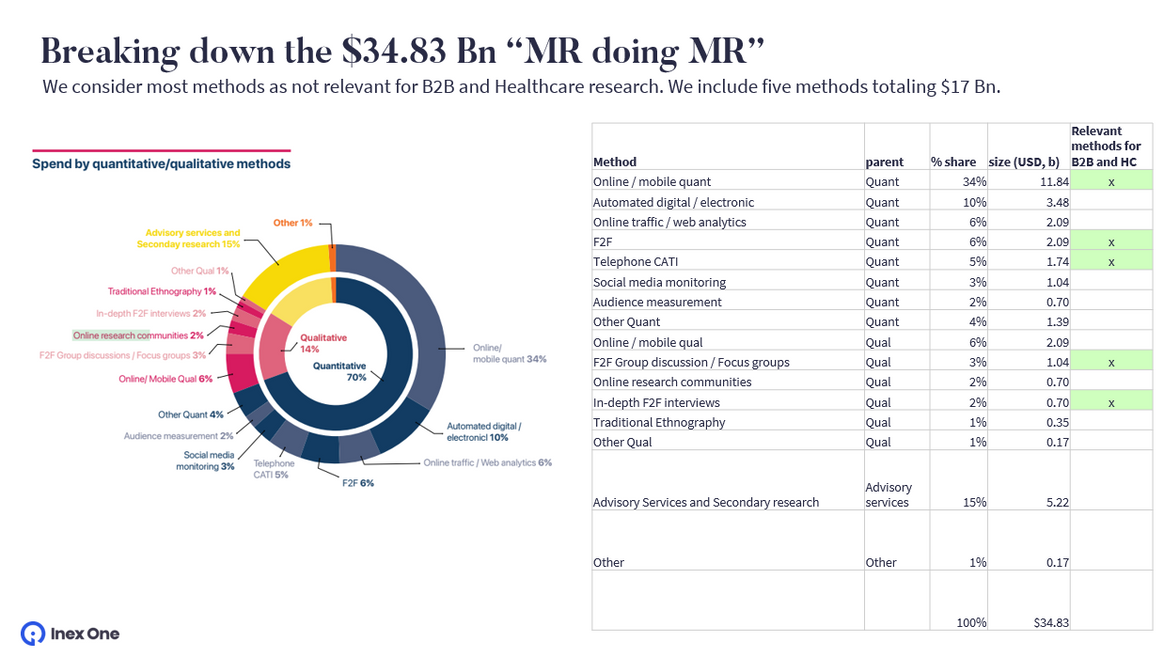
The $34.83 Bn includes all market research methods done by all market research firms globally. These include automated/ passive research like social media monitoring, which isn’t relevant to us sizing the B2B and Healthcare survey industry. We exclude all methods except the five that we consider relevant:
Online / mobile quant
Face-to-face interviews (“F2F”)
Telephone CATI
F2F Group discussion / Focus groups
In-depth F2F interviews
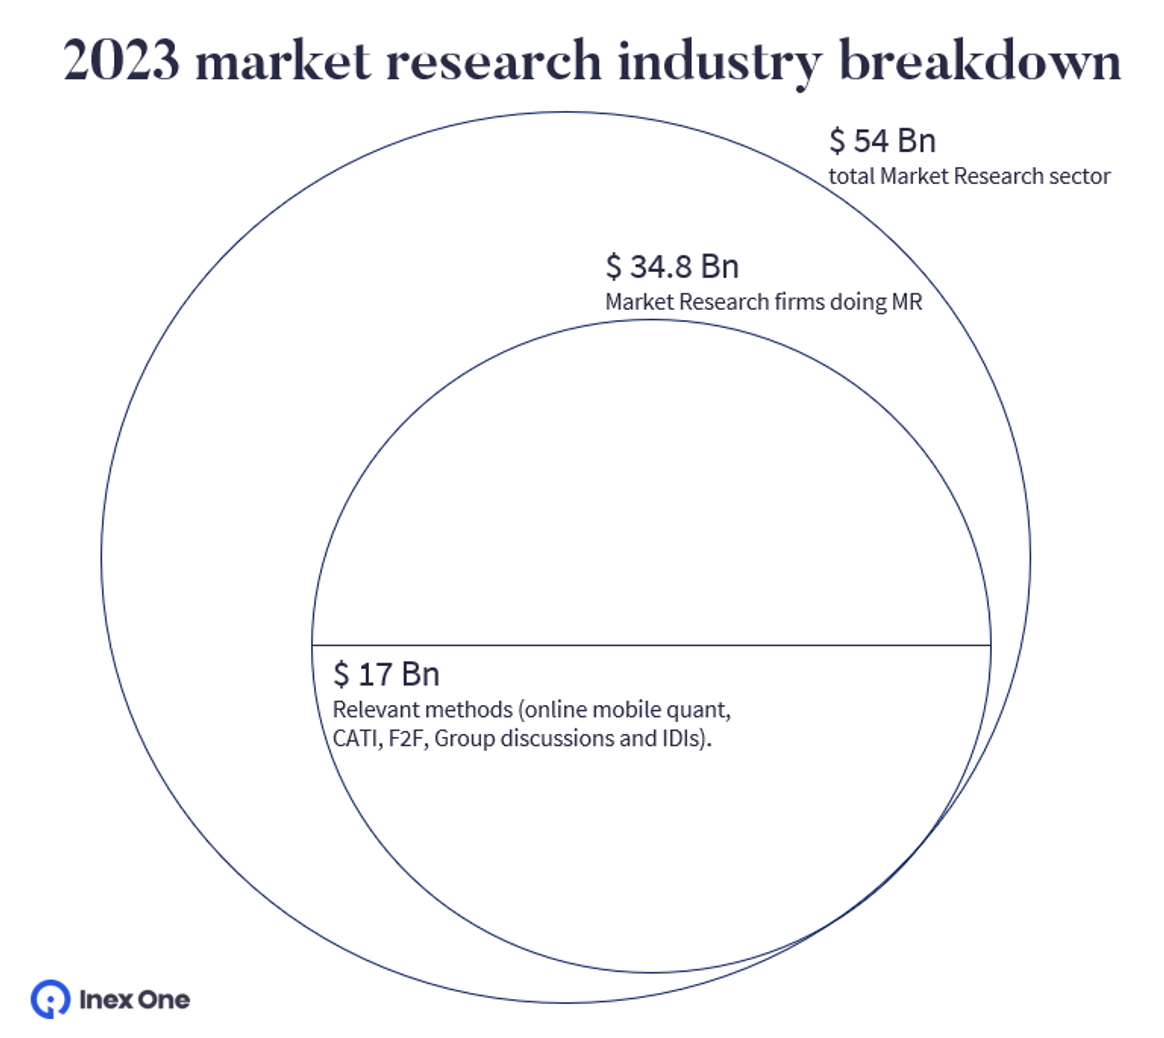
These relevant methods generated $17 Bn in turnover in 2023, making up about half of the total MR doing MR segment.
Bottom-up meets top-down
Then we asked the industry: which companies do you use for B2B and Healthcare surveys?
About 50 firms were mentioned frequently enough, after we excluded companies that primarily resell 3rd party sample or are primarily B2C, e.g. consumer panels, regular fieldwork companies, exchanges, and traditional full-service market research firms.
We estimated the revenue of those 50 firms individually and bottom-up to a total of $7.5 Bn. We did this by triangulating from multiple sources (expert interviews, public financials, reported panel sizes and number of completes, marketing materials, etc.).
From the $7.5 Bn, we removed the parts of these companies that were non-survey sample revenue (e.g. research software, reporting, marketing services, etc.).
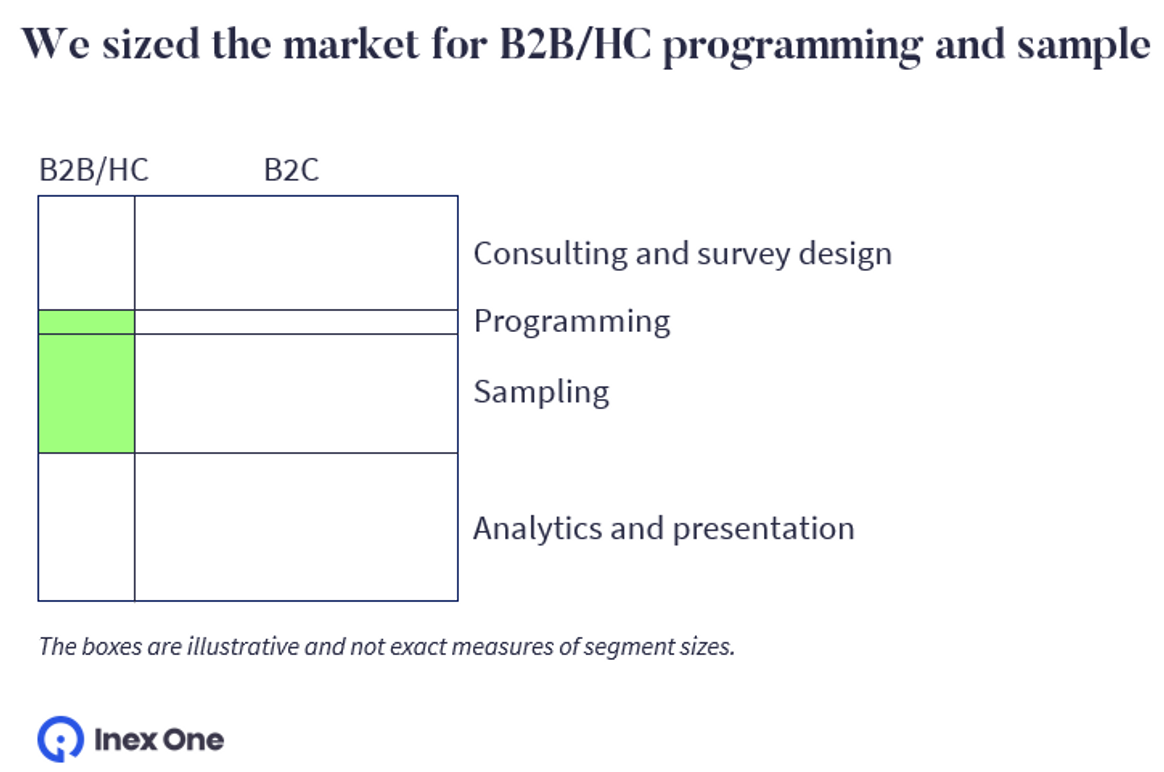
Having excluded $4.4 Bn of non-survey revenue, we had $3 Bn of relevant survey sample revenue left, when summing up all 50 companies. We estimate that about $1.9 Bn of this was B2C revenue, leaving an aggregate of $1.1 Bn of B2B or Healthcare survey sample revenue.
Putting it all together, we get two images showing the numbers from slightly different angles:
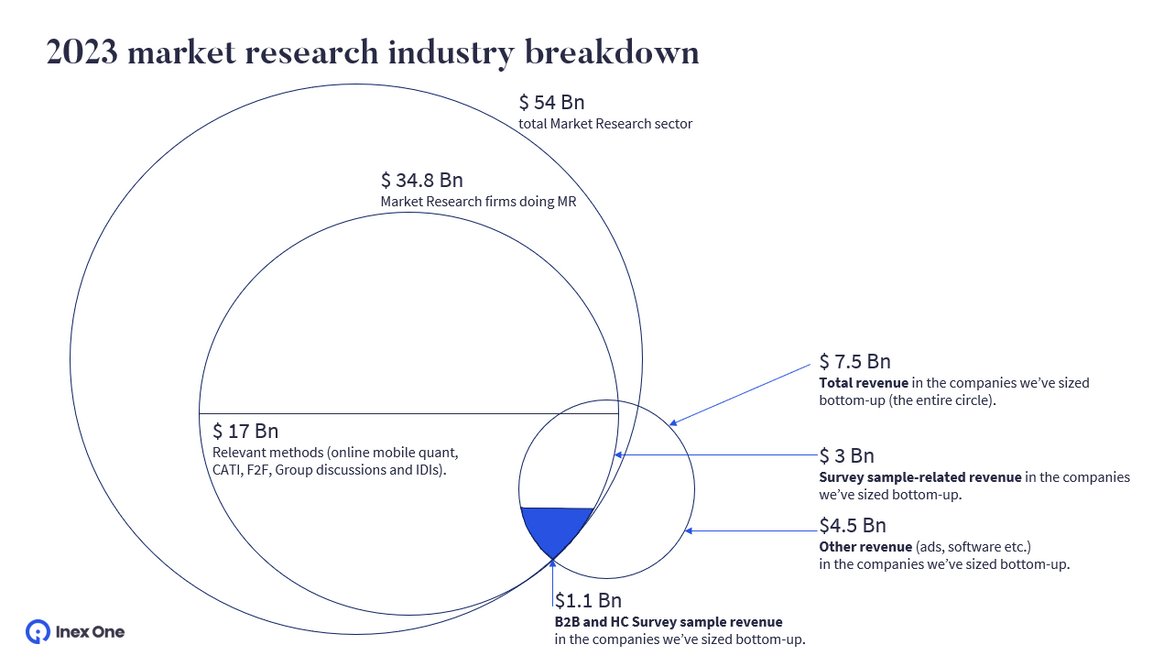
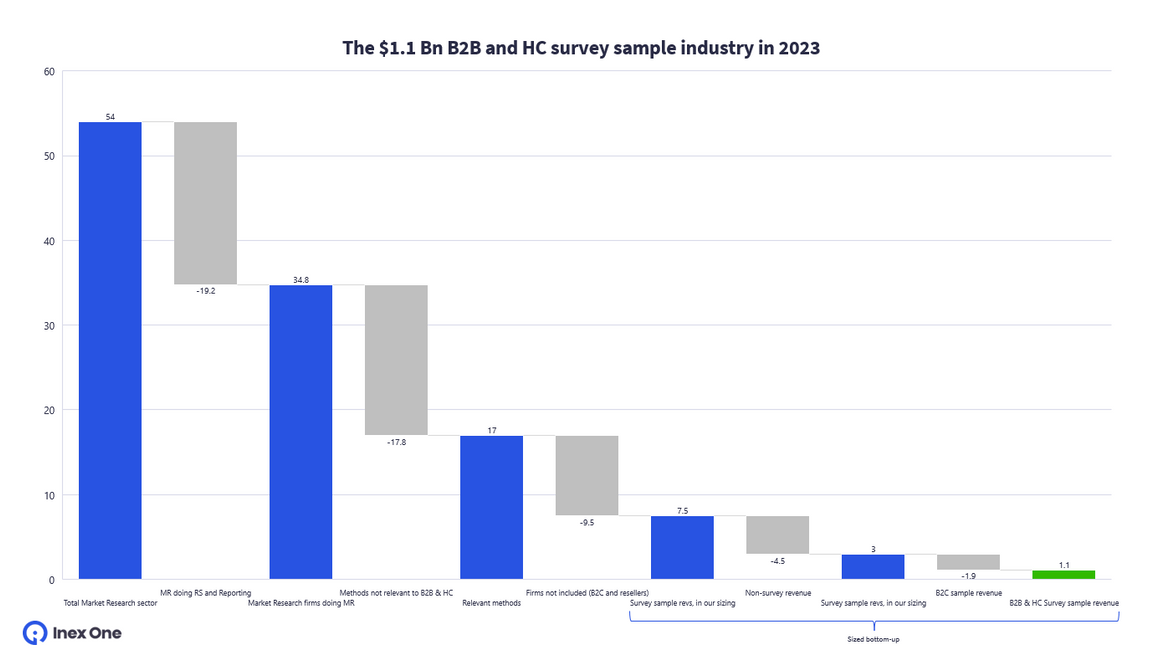
The 50 firms we mapped generated $1.1 bn in B2B and HC survey sample revenue, with total revenues of $7.5 bn. Bridging this number with the $17 bn in relevant methods from ESOMAR, we get $9.5bn in revenue from firms not included in our mapping: firms primarily doing B2C or 3rd party sample.
Looking to skip the heavy lifting of mapping 50 firms and connect with the top B2B and Healthcare survey providers with high-quality, proprietary data? Get started here or book a demo of Inex One.